Proving a groundcover BYOC Deployment Path on AWS
Deploying groundcover BYOC on AWS with EKS, eBPF telemetry, and AI workload observability validation.

Intro
groundcover is an observability platform built around eBPF-based telemetry collection for Kubernetes environments. Instead of relying only on application-level instrumentation, groundcover can observe workload, network, infrastructure, and runtime behavior from the cluster itself.
What made this interesting to me was the BYOC model. In a bring-your-own-cloud deployment, the observability platform runs inside the customer’s cloud environment rather than being consumed only as an external SaaS service. That changes the setup from a simple agent installation into a fuller platform-engineering exercise involving AWS, EKS, networking, storage, Kubernetes services, and telemetry validation.
This post walks through my happy-path setup: deploying groundcover BYOC in my own AWS account, connecting a separate Kubernetes workload cluster, running a demo AI travel-agent application, and validating that the resulting telemetry appeared in the groundcover UI.
This is just scratching the surface with what’s possible with groundcover. The elegance of this platform, in my opinion, resides in its use of eBPF -
1. Purpose
The goal of this setup was to prove a full groundcover BYOC deployment path inside my own AWS account.
The happy path was:
AWS account
→ AWS networking and IAM foundation
→ groundcover BYOC infrastructure
→ groundcover platform cluster
→ test workload Kubernetes cluster
→ groundcover agent/sensor integration
→ telemetry visible in groundcover UI
The important part is that this was not just “install an agent.” It was a full customer-style BYOC flow where the observability platform and supporting infrastructure live in my cloud environment, and a separate workload cluster is connected to it for telemetry collection.
2. Layered Architecture
At a high level, I thought about the setup as a set of layers:
AWS Account
└── Region: us-east-1
    │
    ├── Layer 1: AWS Foundation
    │   ├── IAM roles and permissions
    │   ├── VPC networking
    │   ├── Subnets
    │   ├── Route tables
    │   ├── Security groups
    │   └── AWS service access
    │
    ├── Layer 2: groundcover BYOC Infrastructure
    │   ├── EKS cluster for groundcover platform
    │   ├── RDS / Postgres backend
    │   ├── Load balancer / ingress
    │   ├── Kubernetes services
    │   └── groundcover-managed platform components
    │
    ├── Layer 3: groundcover Runtime Services
    │   ├── groundcover UI/API
    │   ├── telemetry ingestion services
    │   ├── collectors / processors
    │   ├── storage-backed services
    │   └── platform health checks
    │
    ├── Layer 4: Test Workload Cluster
    │   ├── Separate EKS cluster
    │   ├── Test namespace
    │   ├── Demo workload pods/services
    │   └── Traffic generation
    │
    └── Layer 5: Telemetry Integration
        ├── groundcover agent / sensor
        ├── eBPF-based infrastructure visibility
        ├── Kubernetes metadata enrichment
        ├── Logs, metrics, traces
        └── Validation in groundcover UI
This layering helped me separate infrastructure setup from product validation. Creating cloud resources is one milestone, but the real goal is to prove that telemetry from a running workload appears in groundcover.
3. Layer 1 — AWS Foundation
This layer is the basic AWS substrate required before groundcover or the workload cluster can function.
Key services involved
- IAM — Permissions for EKS, nodes, add-ons, and groundcover-managed resources
- VPC — Network boundary for the deployment
- Subnets — Placement for EKS nodes, RDS, load balancers, and services
- Security groups — Network access control between AWS services
- EKS — Kubernetes control plane for platform and workload clusters
- RDS — Postgres backend used by the groundcover BYOC deployment
- ELB / Load Balancer — External or internal access to groundcover services
Happy-path idea
Before installing groundcover, the AWS account needs enough baseline infrastructure to support:
Kubernetes control planes
→ worker nodes
→ persistent backend services
→ internal service-to-service communication
→ external UI/API/ingestion access where required
This is the first “customer reality” of BYOC: the product installation depends on the cloud account already having the right network, IAM, and service permissions.
4. Layer 2 — groundcover BYOC Platform Infrastructure
The groundcover BYOC platform was deployed into the AWS account as its own platform stack.
In my setup, the groundcover platform EKS cluster had a name like:
groundcover-iv28xndpfAnd the RDS/Postgres backend had a name like:
groundcover-postgres-iv28xndpfThe platform layer is responsible for running the groundcover backend services inside the customer-controlled cloud environment.
Main components
- groundcover EKS cluster — Runs groundcover platform services
- RDS/Postgres — Stores platform metadata, configuration, and state
- Load balancer / ingress — Provides access to groundcover services
- Kubernetes deployments — Run the groundcover application services
- Kubernetes services — Expose internal components to each other
- Secrets/configuration — Connect platform components to backend dependencies
Happy-path flow
Provision groundcover BYOC stack
→ EKS cluster becomes active
→ RDS/Postgres is created
→ groundcover services are deployed into Kubernetes
→ ingress/load balancer becomes available
→ groundcover platform becomes reachable
The successful state is not merely:
EKS existsThe real successful state is:
groundcover platform cluster is healthy
+ backend database is reachable
+ platform services are running
+ UI/API/ingestion endpoints are reachable
After the BYOC platform infrastructure was deployed, the next validation step was to confirm that groundcover could see the connected Kubernetes environment and its running workloads.
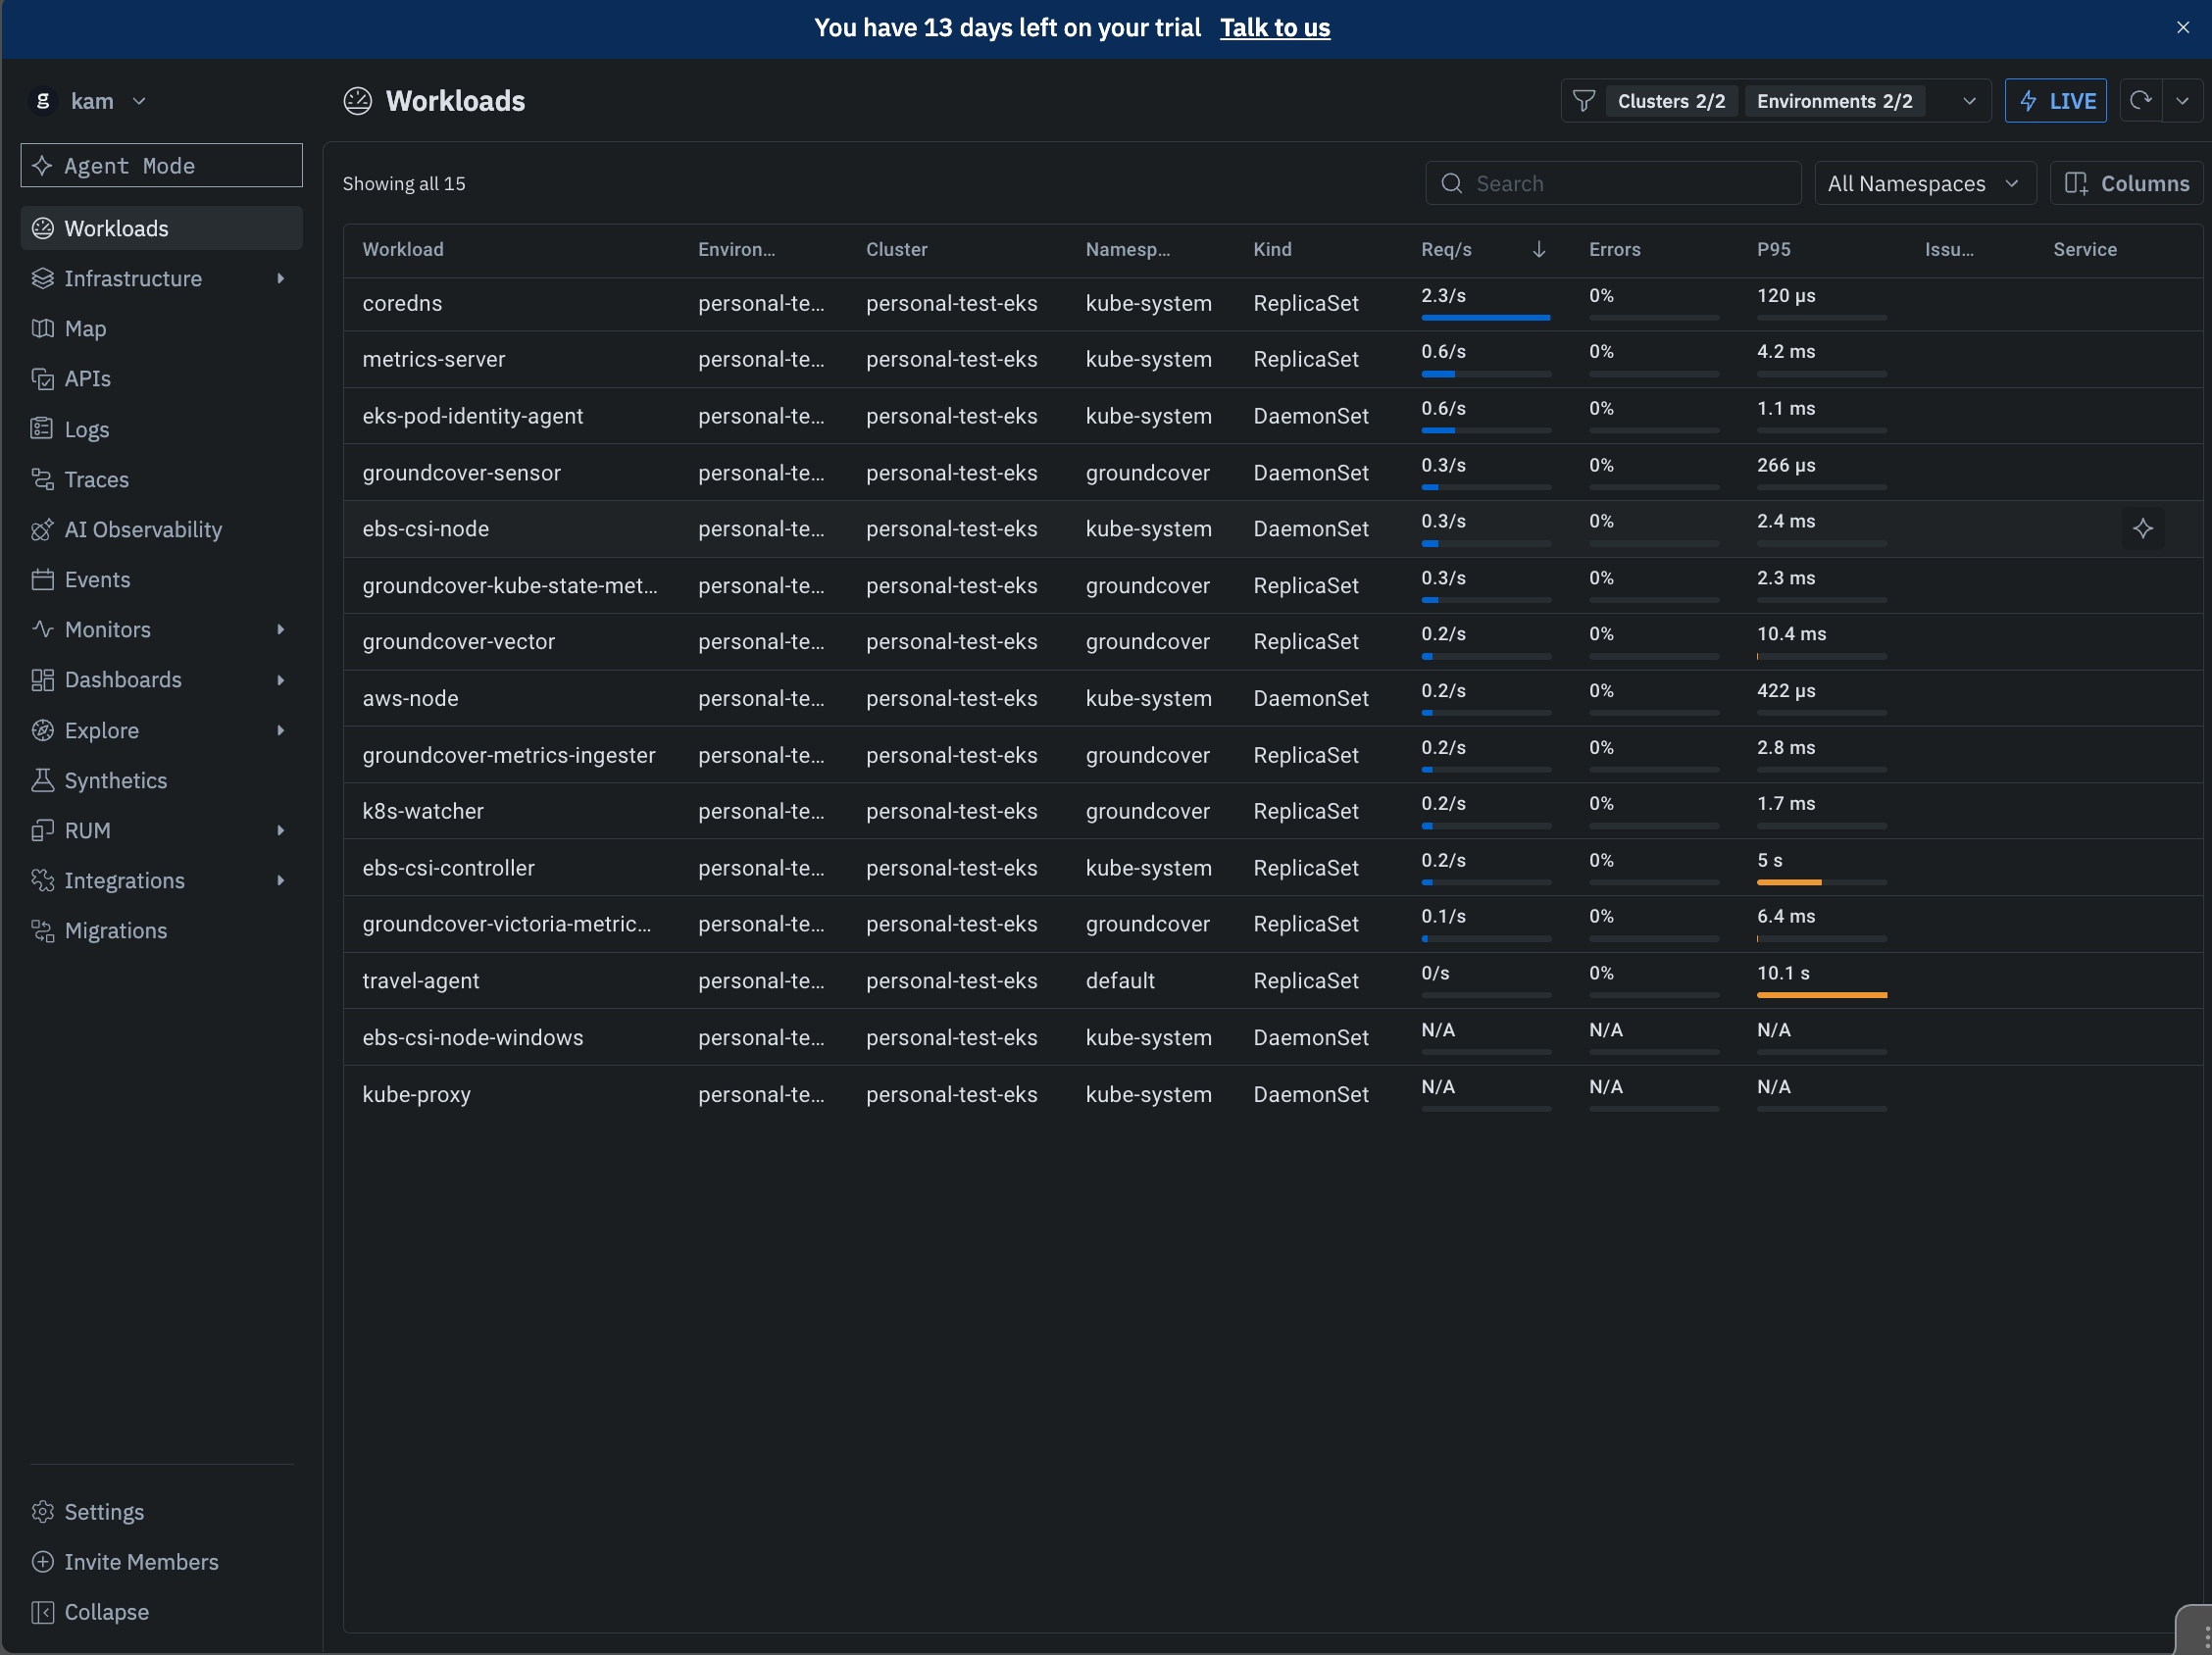
The workload inventory view shows the connected Kubernetes environment after the BYOC setup is active. At this point, groundcover is no longer just installed infrastructure — it can see running Kubernetes workloads, namespaces, request rates, error rates, and latency signals across the cluster.
5. Layer 3 — groundcover Runtime Services
Once the infrastructure exists, the next layer is the actual groundcover runtime.
This is where the BYOC deployment becomes a usable observability platform.
Runtime responsibilities
- UI/API — Lets the user inspect services, traces, logs, metrics, and topology
- Ingestion — Receives telemetry from connected clusters
- Processing — Normalizes, enriches, and stores telemetry
- Kubernetes awareness — Adds cluster, namespace, pod, workload, and service context
- eBPF-based visibility — Captures low-level infrastructure and network behavior
- Storage integration — Uses backend services such as Postgres and other managed components
Happy-path validation
At this point, the validation checklist is:
groundcover UI is reachable
platform services are healthy
database is available
no critical pods are crash-looping
ingestion endpoint exists
cluster shows as ready to receive telemetry
Once the BYOC runtime was running, I used the infrastructure view to validate that the Kubernetes-level runtime components were actually present and healthy.
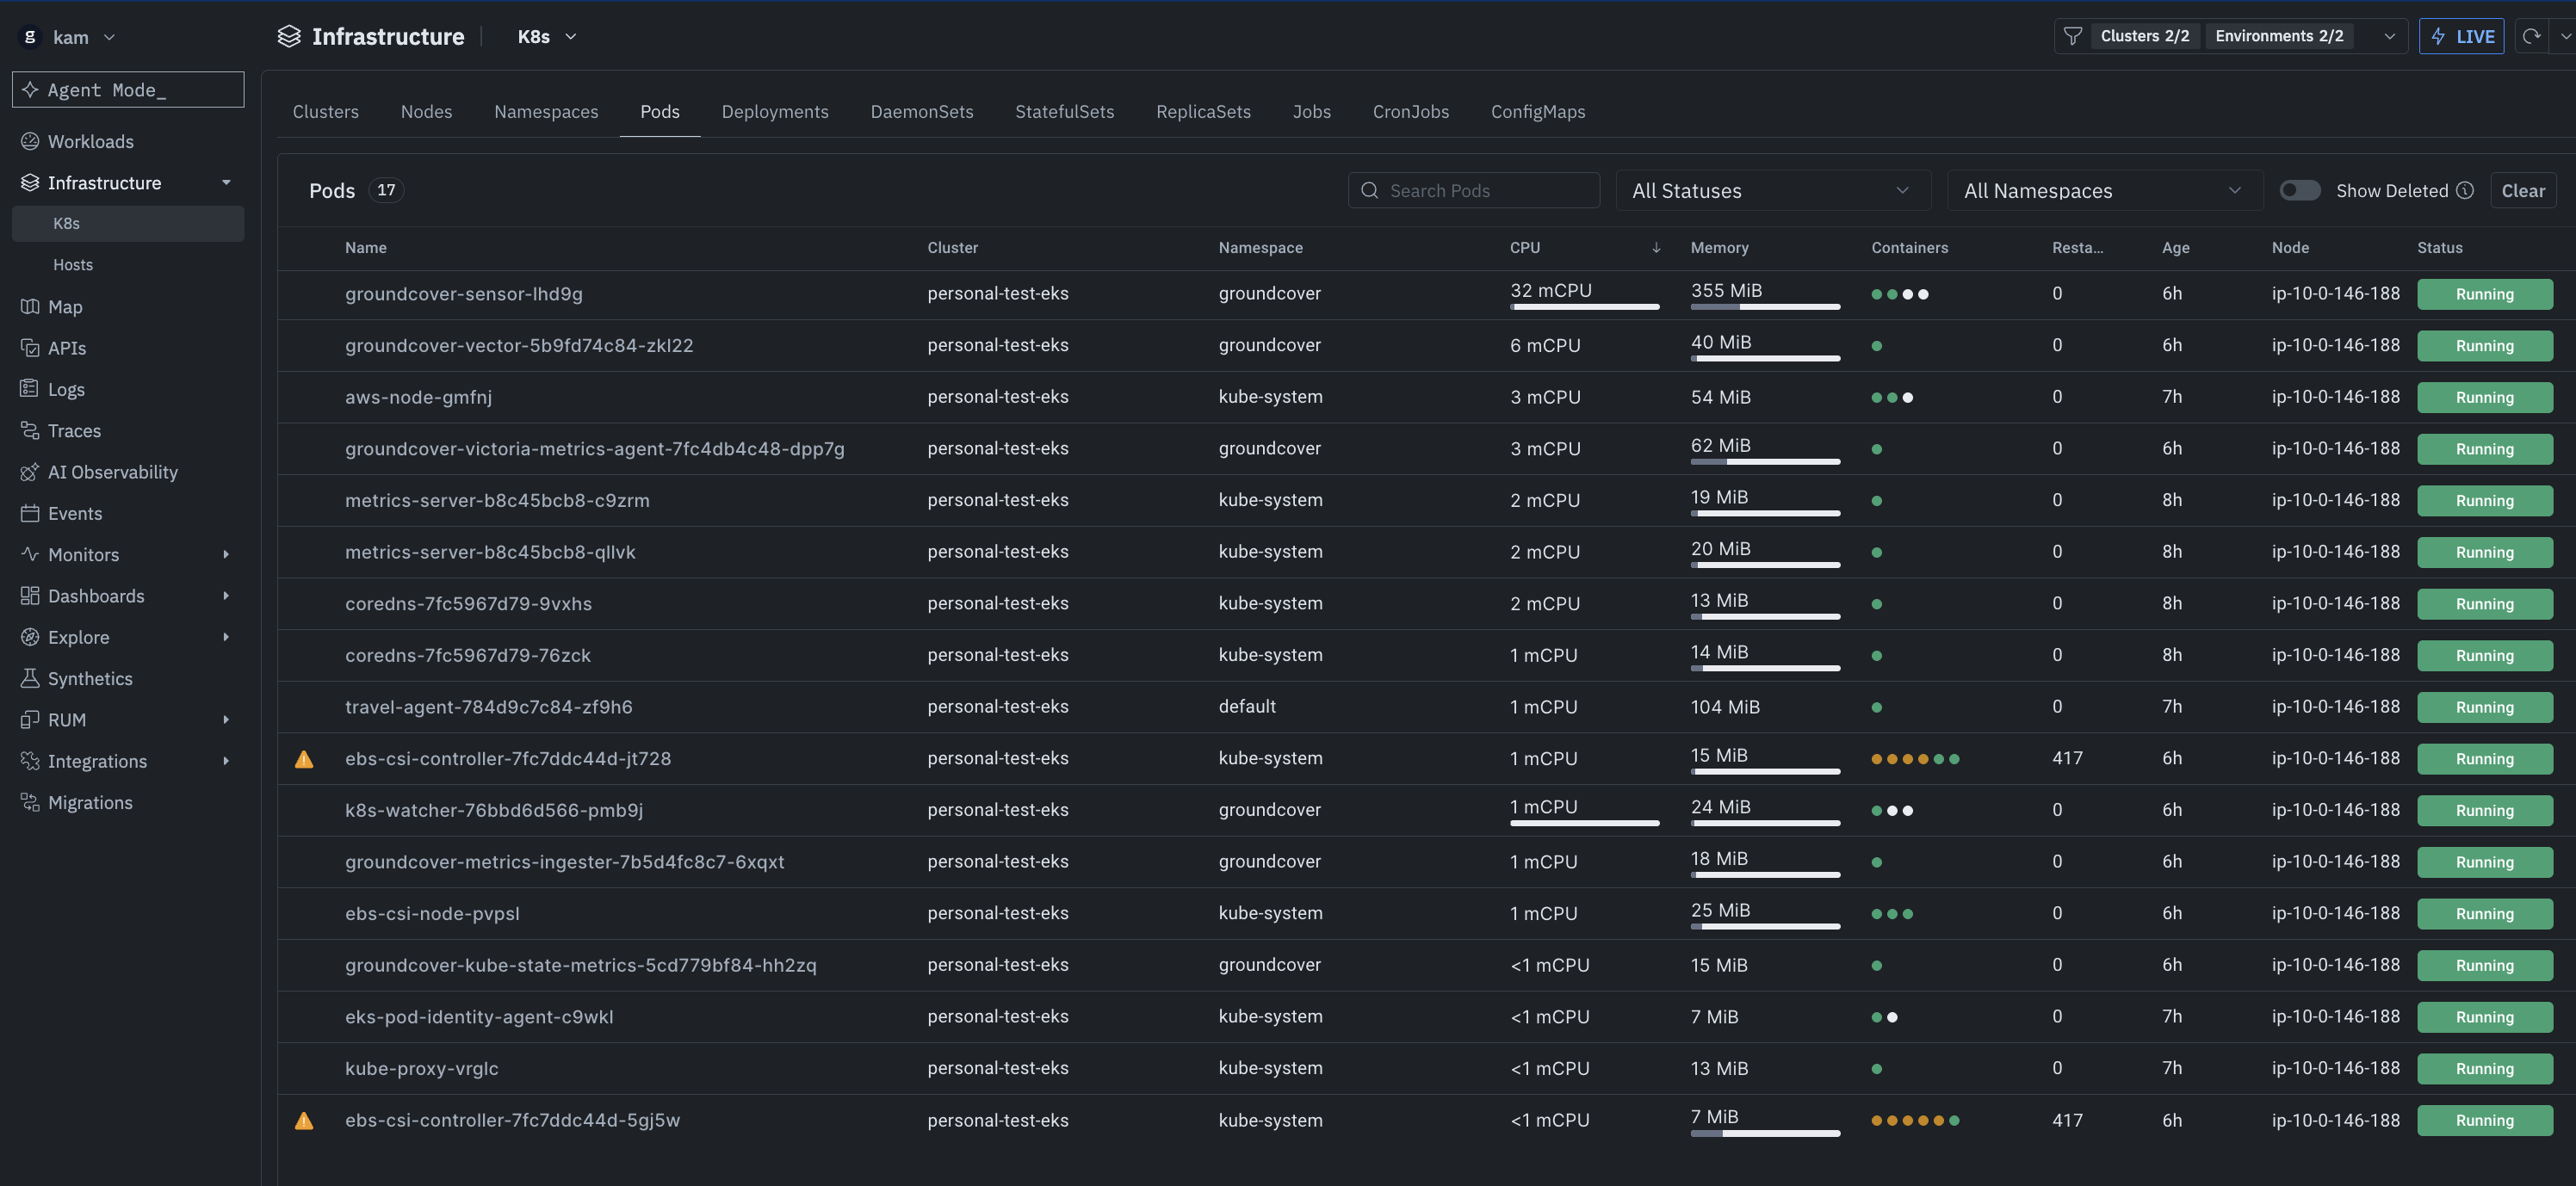
The infrastructure pods view shows the running Kubernetes components behind the setup, including the groundcover agent, sensor, metrics components, and workload pods. This helped confirm that the environment was not only provisioned, but also running the services needed for telemetry collection.
6. Layer 4 — Test Workload Cluster
The next layer is the workload environment.
This should be kept conceptually separate from the groundcover platform cluster.
groundcover platform cluster
≠
test workload cluster
The platform cluster runs groundcover. The workload cluster runs the application I want to observe.
Workload cluster purpose
The test workload cluster exists to answer:
Can I connect a real Kubernetes workload to groundcover and see meaningful telemetry?
Components
- Separate EKS cluster — Represents a customer workload environment
- Test namespace — Isolates demo app resources
- Demo workload — Generates traffic, logs, metrics, traces, or service activity
- Kubernetes services — Expose the workload internally or externally
- Traffic generation — Produces activity for groundcover to observe
Happy-path flow
Create test workload EKS cluster
→ deploy demo app
→ expose app/service
→ generate traffic
→ confirm pods are running
→ confirm workload behaves normally before observability validation
This matters because I wanted to separate two questions:
- Is the workload running?
- Is groundcover observing it?
A bad workload deployment should not be confused with a telemetry problem.
7. Layer 5 — Telemetry Integration
This is the most important part of the path.
After the workload cluster is running, the groundcover agent/sensor is installed or connected so that the workload cluster reports telemetry into the groundcover BYOC platform.
Telemetry flow
Workload pods
→ Kubernetes node/runtime activity
→ groundcover agent / sensor
→ eBPF + Kubernetes metadata collection
→ groundcover ingestion endpoint
→ groundcover backend services
→ groundcover UI
Signals expected
- Kubernetes metadata — Cluster, namespace, pod, deployment, and service context appears
- Infrastructure metrics — Node, pod, and container resource behavior is visible
- Network/service activity — Service communication and dependencies become visible
- Logs — Workload logs are searchable or correlated
- Traces — Application/request flows appear if instrumented or captured
- Topology — Services and dependencies are visualized
Happy-path validation
The validation sequence was:
Install/connect groundcover agent
→ verify agent pods are running
→ generate workload traffic
→ open groundcover UI
→ find the workload cluster
→ find the namespace
→ find the service/workload
→ inspect metrics/logs/traces/topology
→ confirm telemetry updates as new traffic is generated
The key success criterion was:
I can create activity in the test workload cluster and observe that activity in groundcover.
The first validation view was the service map, which showed whether groundcover understood the workload as part of a connected system.
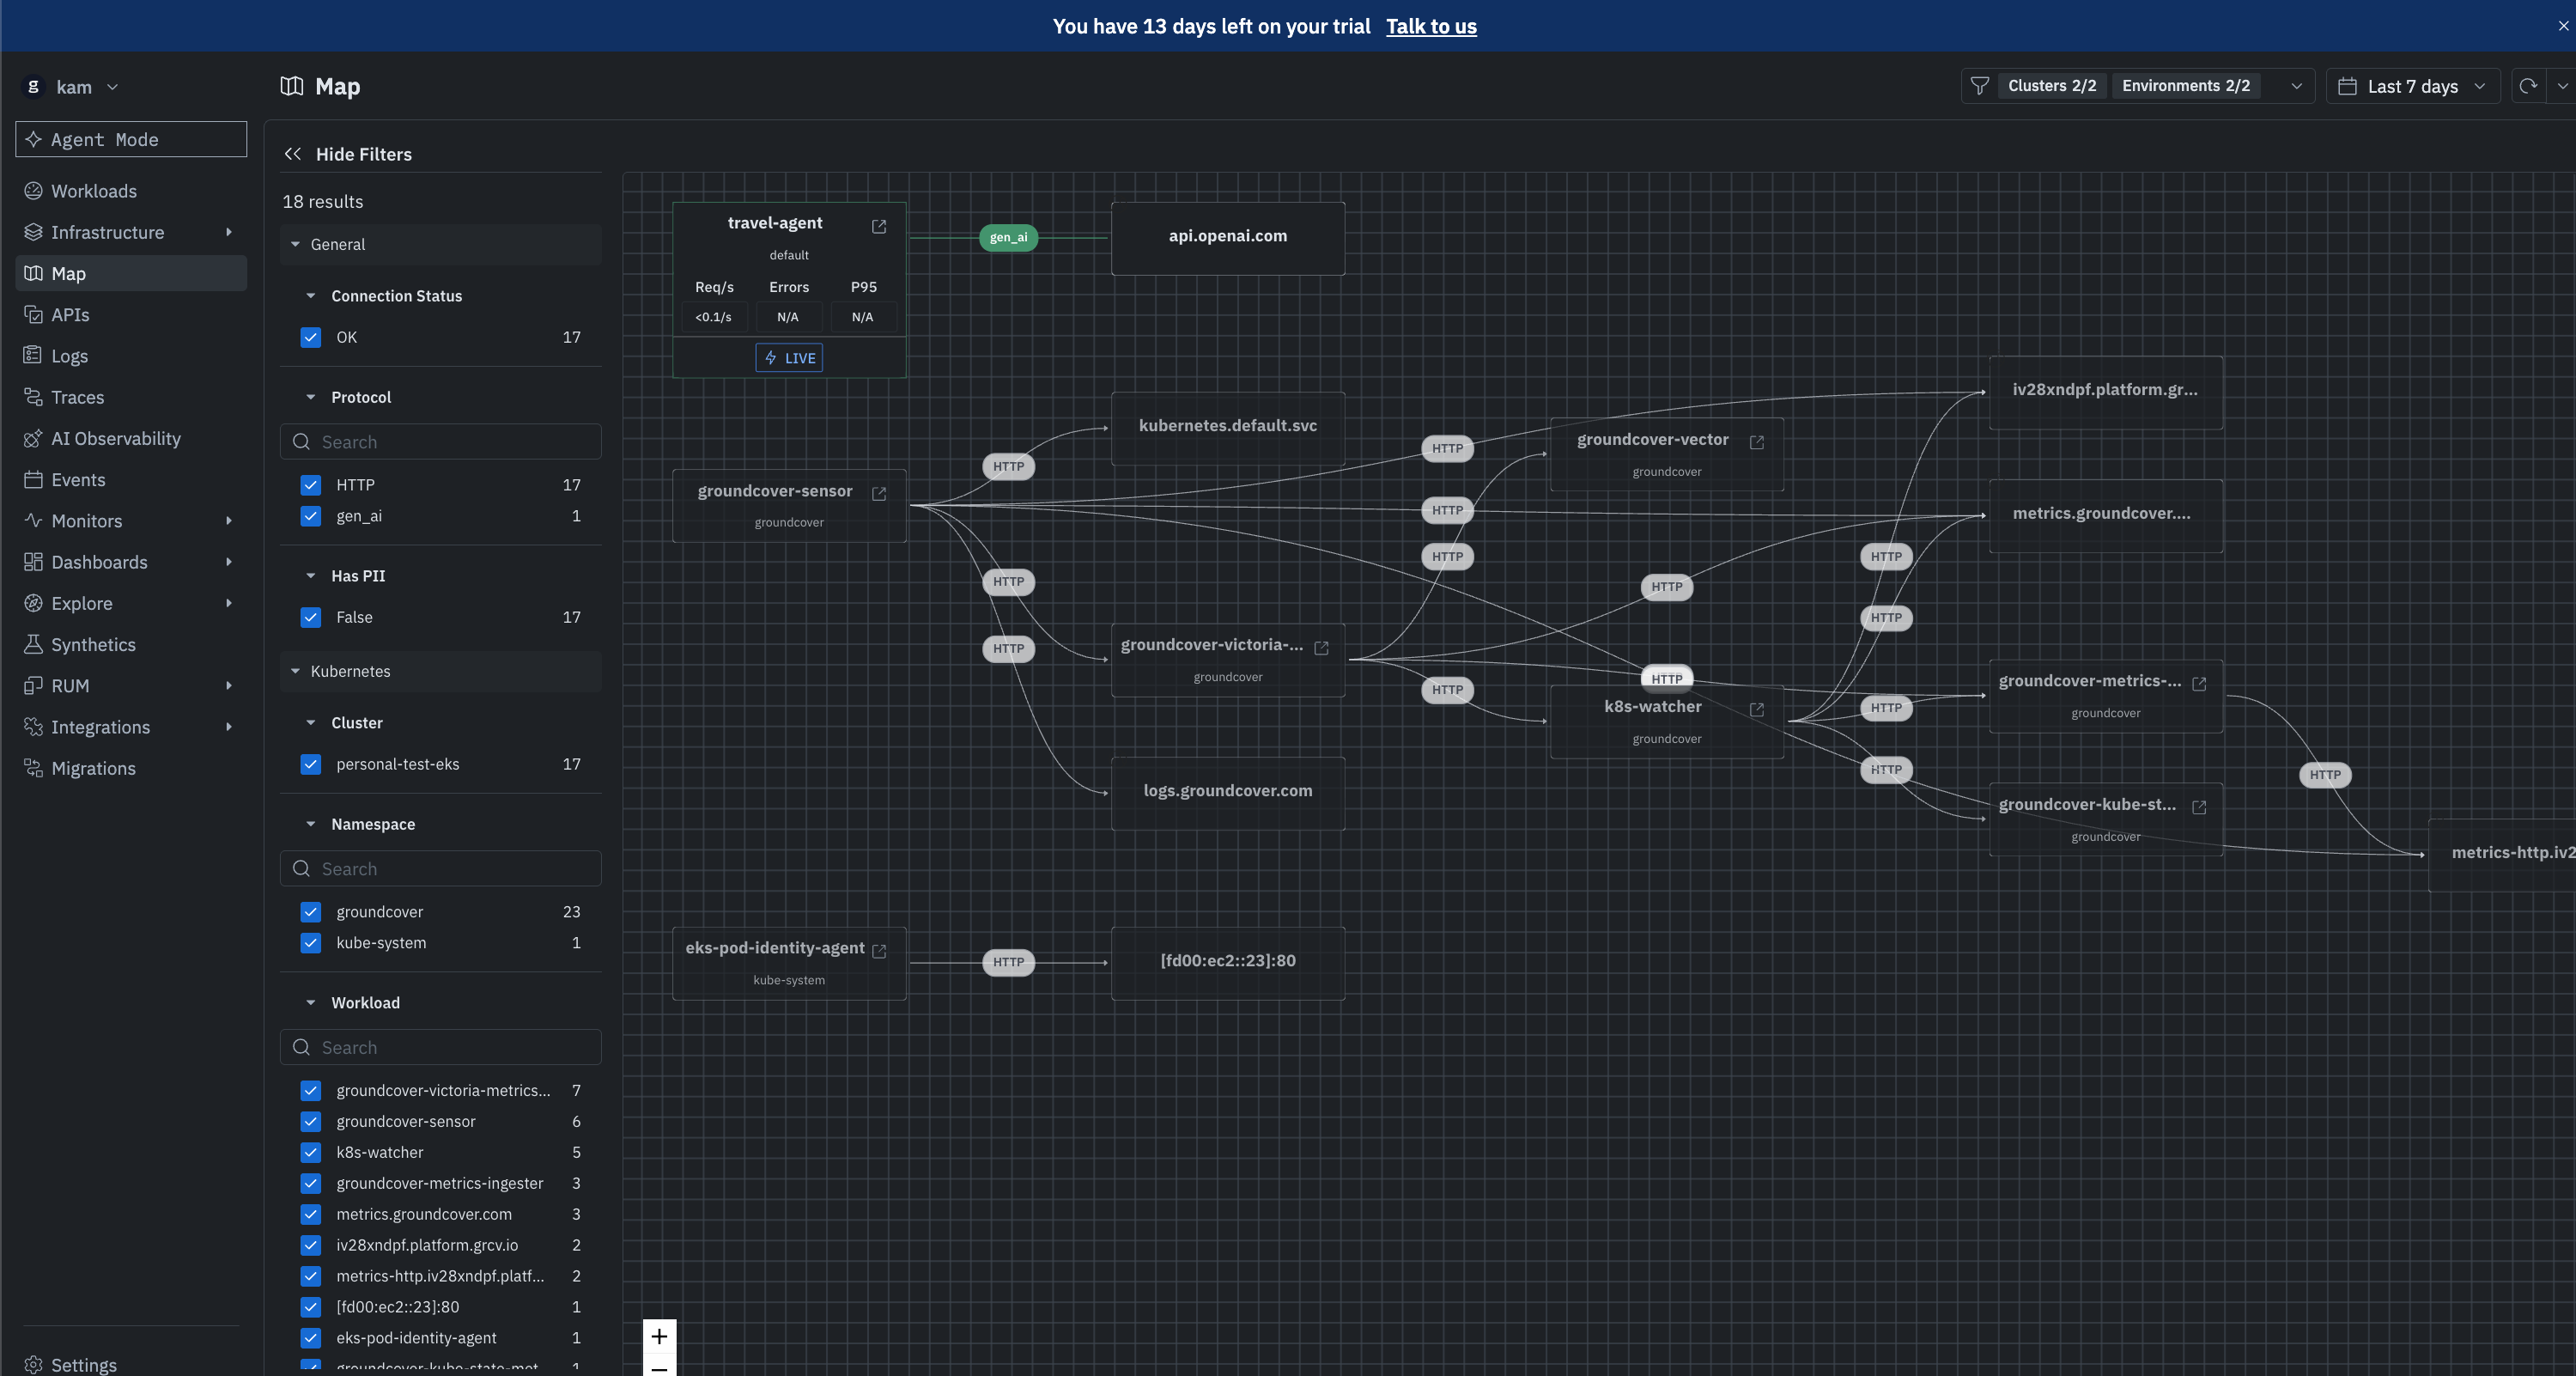
The service map shows the test workload as part of a live dependency graph. In this view, groundcover surfaces the travel-agent service, its dependency on the OpenAI API, and the surrounding collection and ingestion components. This was the first clear sign that the workload was being observed as a connected system rather than as isolated pods.
The next check was request-level visibility for traffic generated against the demo application.
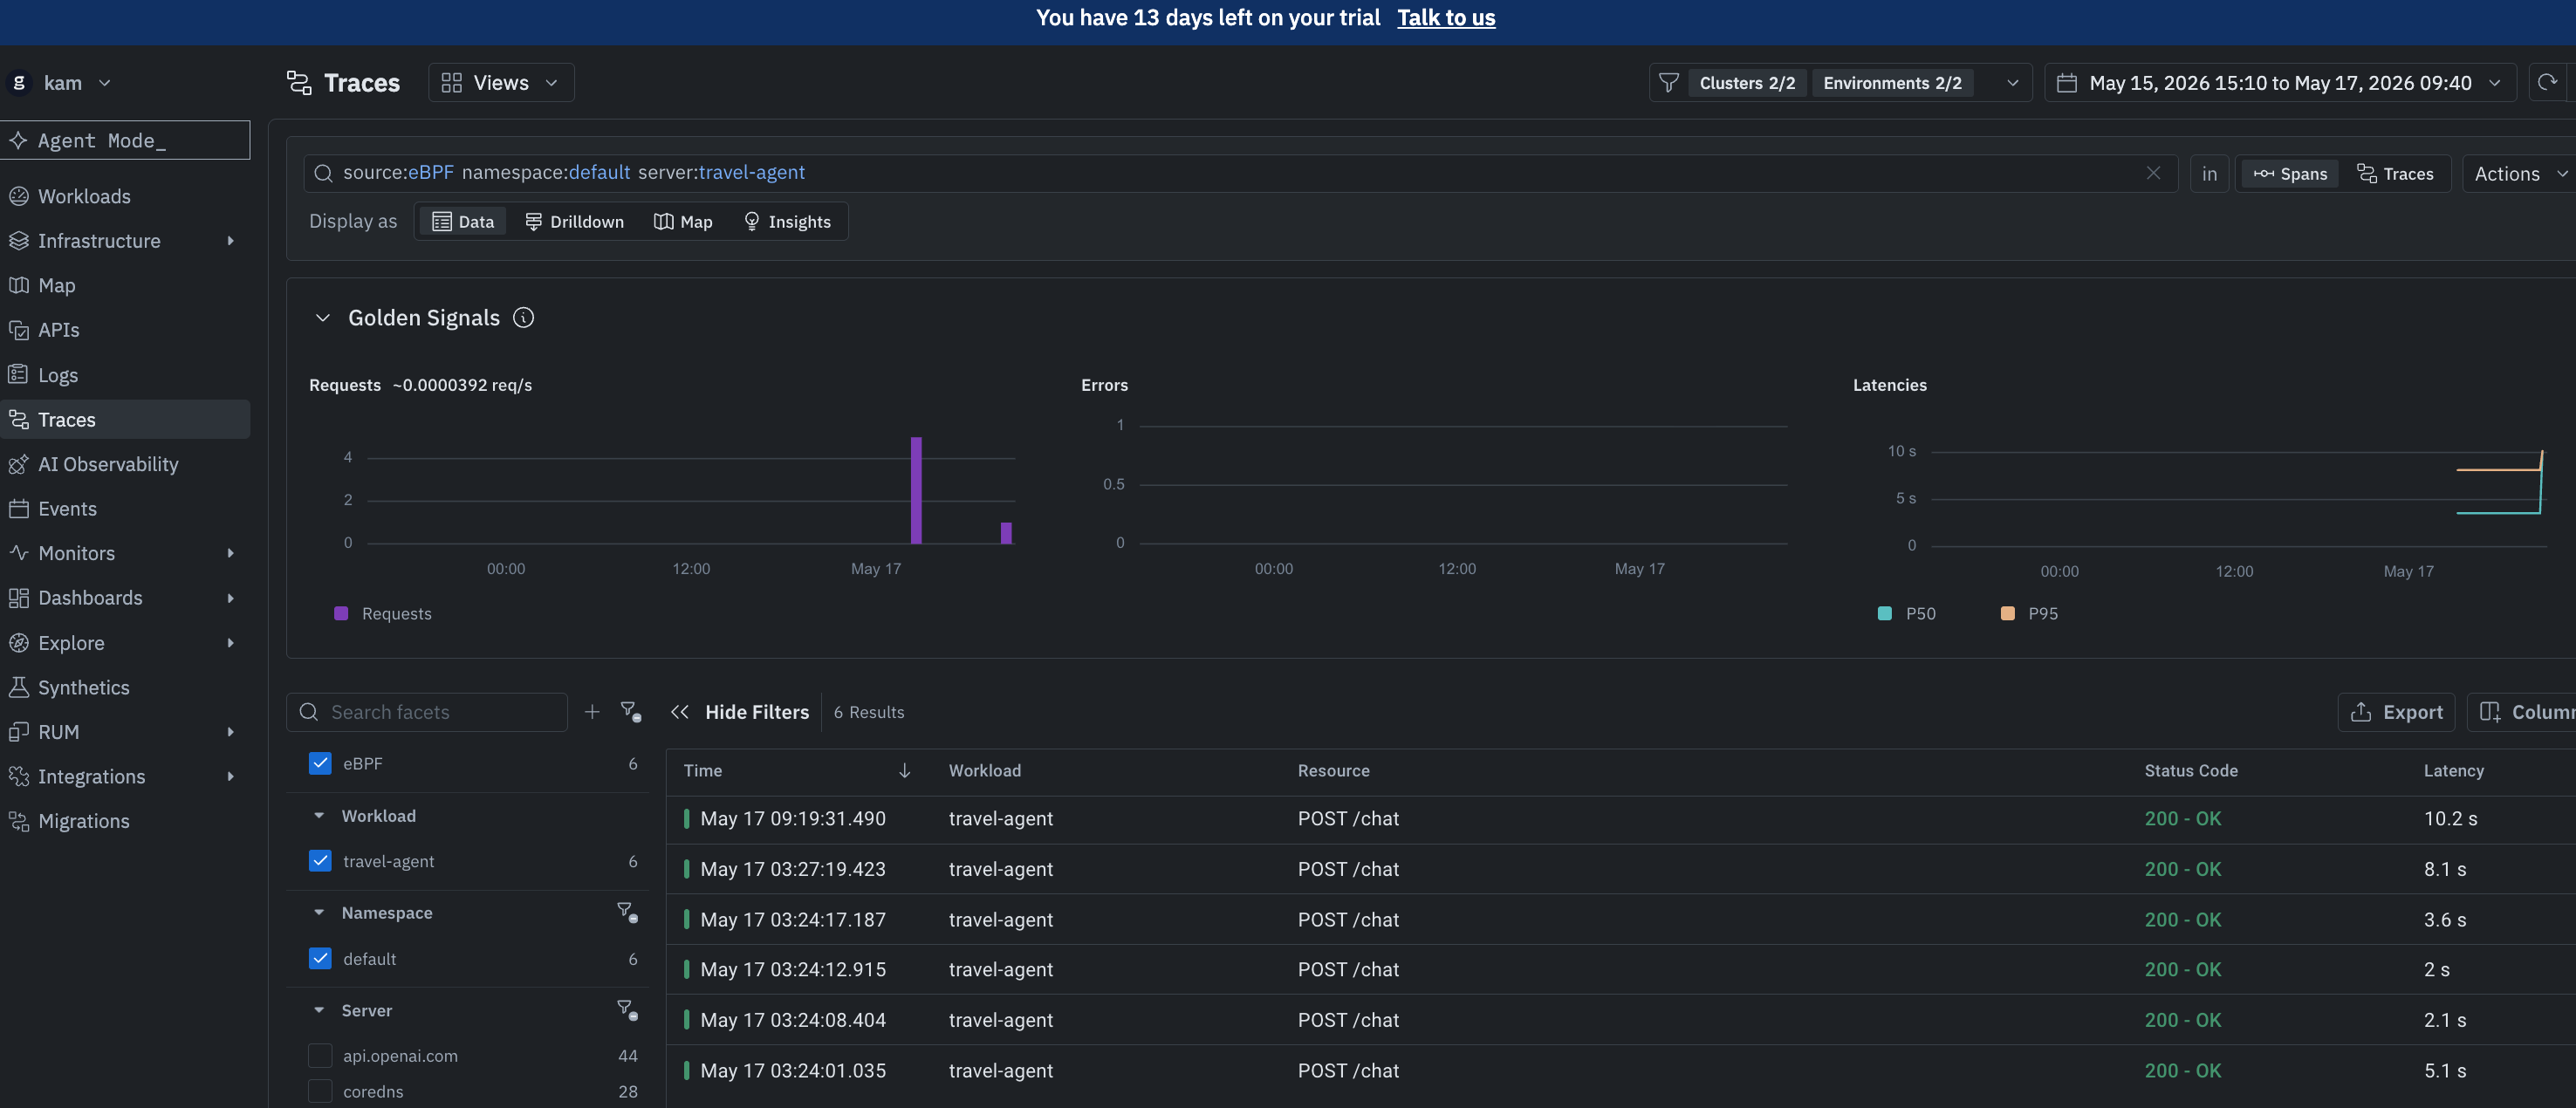
The traces view shows request activity for the travel-agent workload. This is the key happy-path proof point: traffic was generated against the demo app, groundcover captured the activity, and the UI exposed useful request metadata such as workload, namespace, latency, status code, and endpoint information.
Because the demo application was an AI travel agent, I also checked whether the activity showed up in groundcover’s AI Observability view.
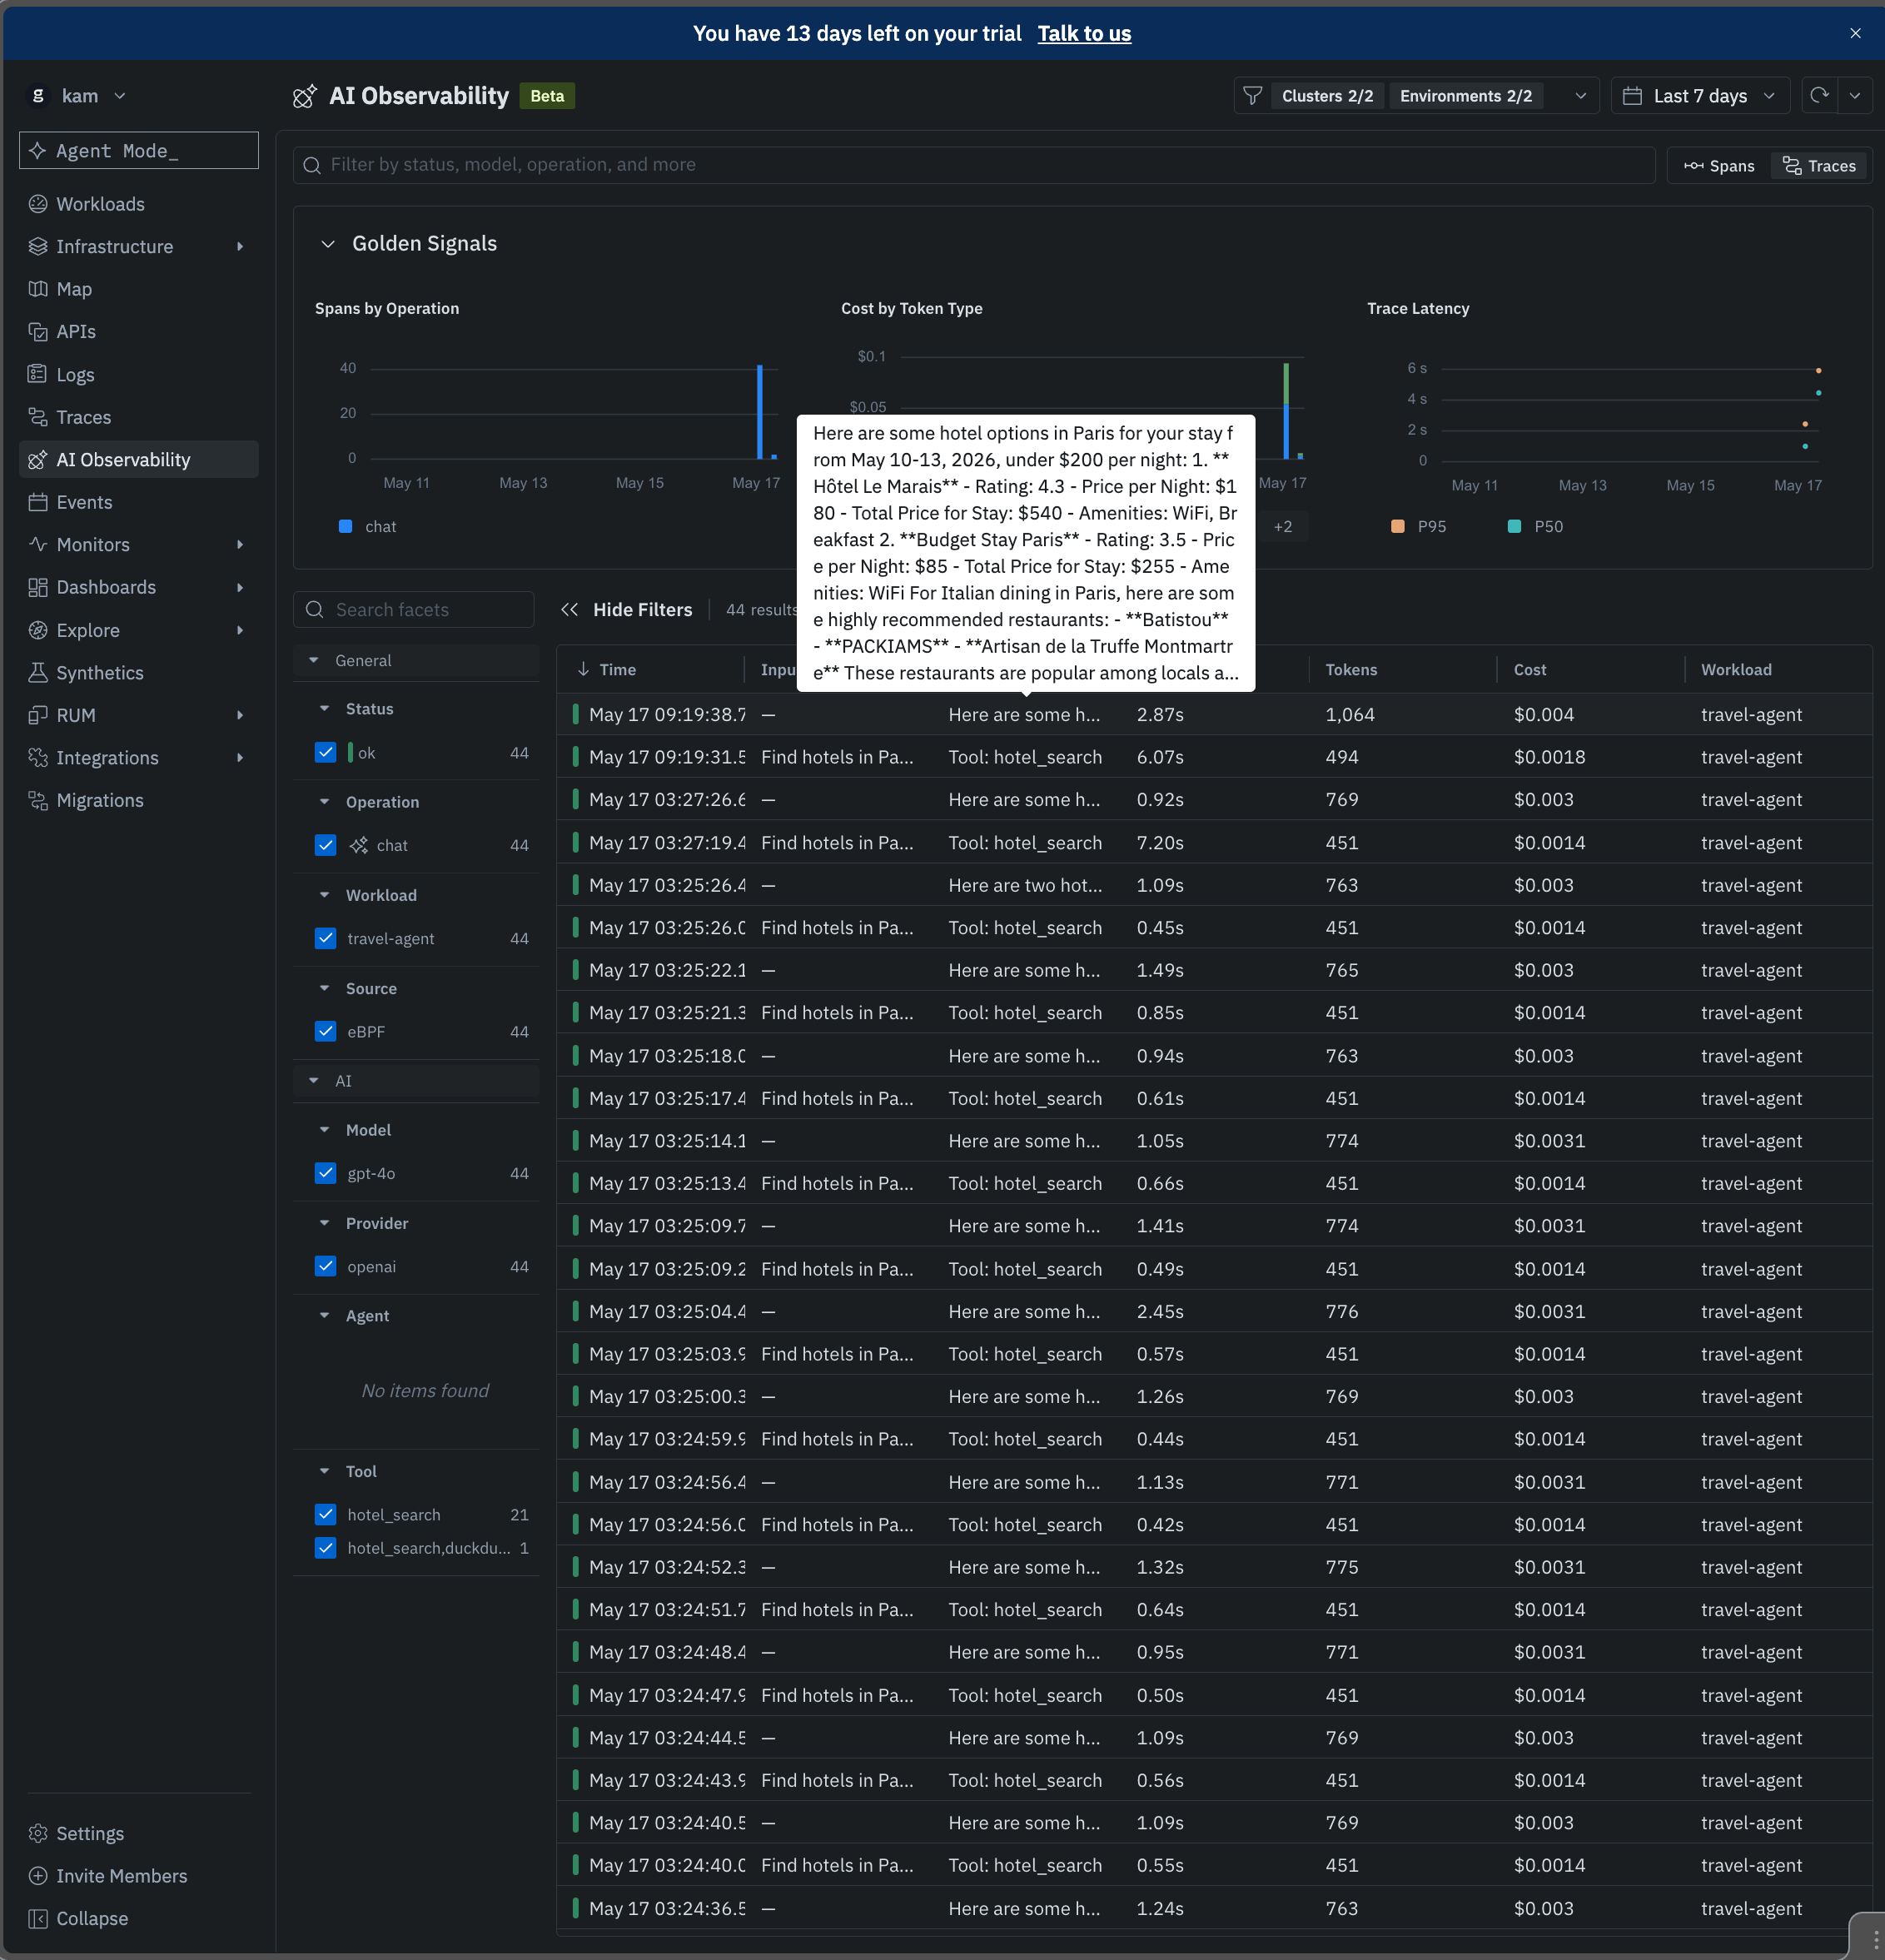
The AI Observability view adds application-level context on top of the infrastructure telemetry. Here, groundcover surfaces model activity, token usage, cost, latency, workload context, and tool-related facets for the AI request flow.
Finally, I drilled into a single AI trace to confirm that the platform could expose the internal flow of the agent interaction.
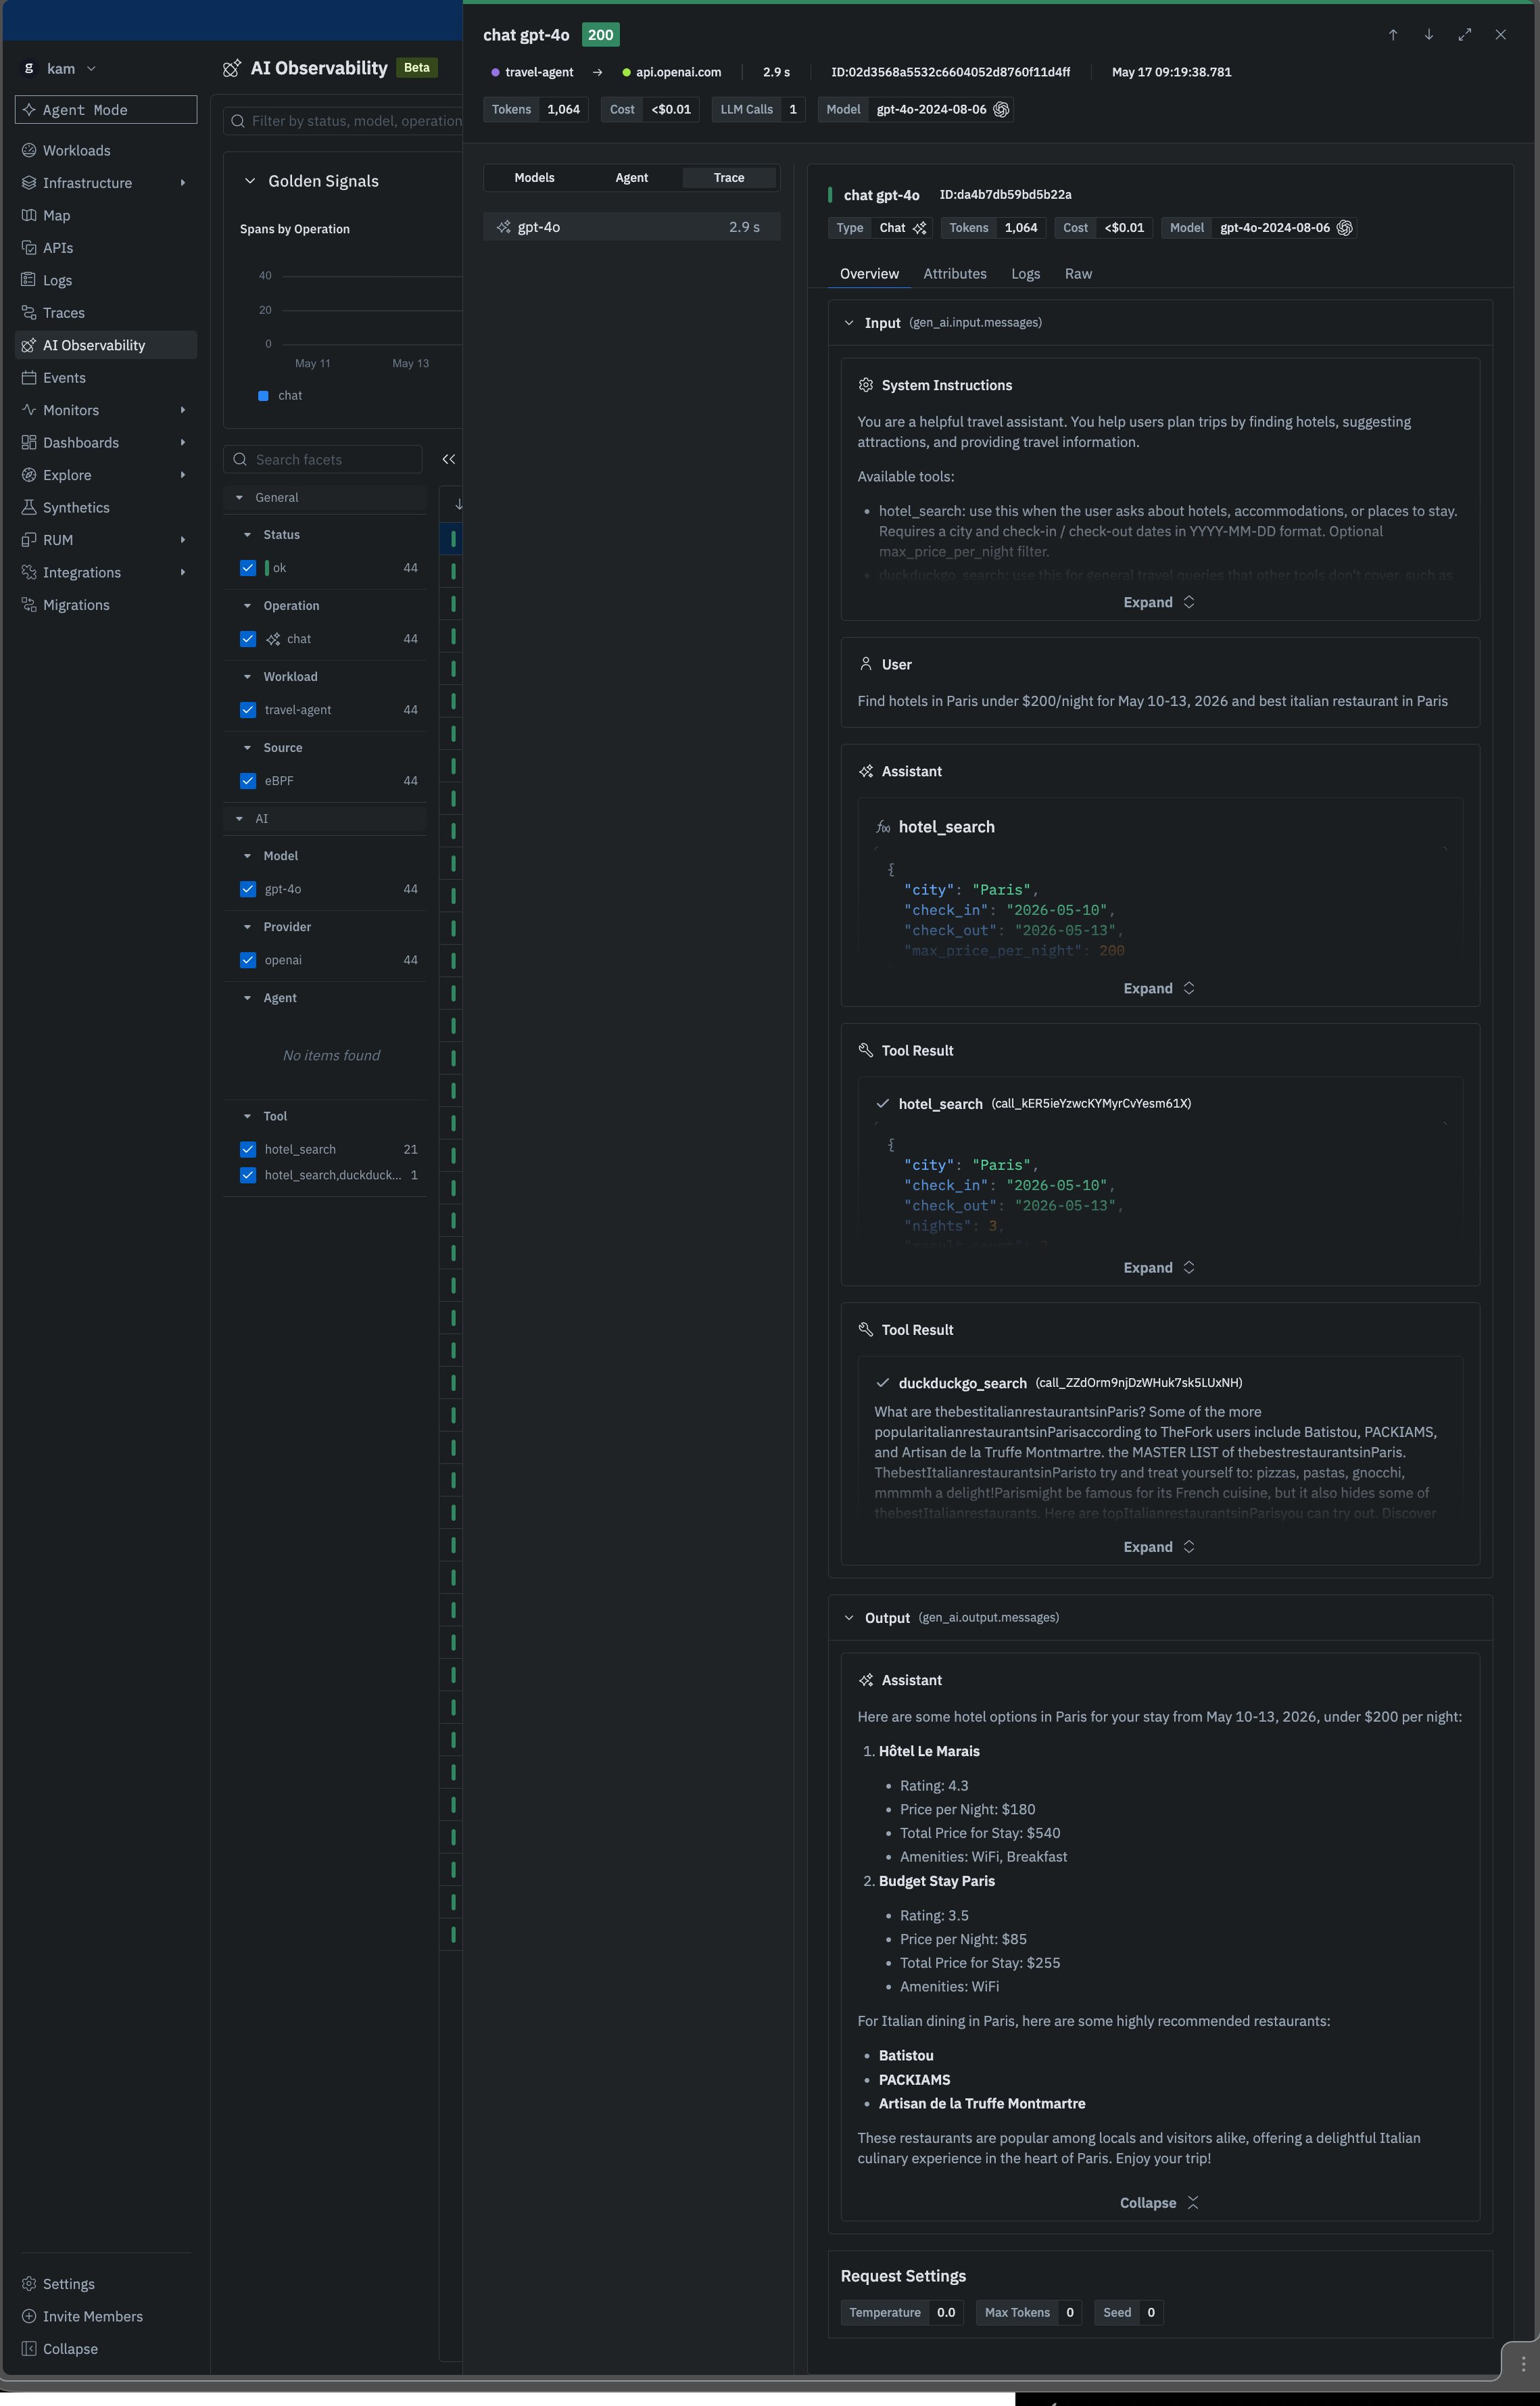
The trace detail view shows the prompt, model call, tool invocation, tool result, and final assistant response. This confirmed that the workload was not only visible as Kubernetes infrastructure, but also understandable as an AI application with model behavior and tool usage.
8. End-to-End Happy Path
Here is the full sequence in one view:
1. Choose AWS region
   ↓
2. Prepare IAM/networking prerequisites
   ↓
3. Deploy groundcover BYOC infrastructure
   ↓
4. Confirm groundcover EKS cluster is active
   ↓
5. Confirm RDS/Postgres backend is available
   ↓
6. Confirm groundcover platform services are healthy
   ↓
7. Deploy separate workload EKS cluster
   ↓
8. Deploy test workload application
   ↓
9. Install/connect groundcover agent to workload cluster
   ↓
10. Generate application traffic
   ↓
11. Validate telemetry in groundcover UI
   ↓
12. Document findings, rough edges, and cleanup behavior
9. Customer-Style Mental Model
The most useful way to think about this setup is not as a single installation step, but as a customer-style platform path.
There are really two systems involved:
groundcover platform environment
+
observed workload environment
The first system runs the observability platform. The second system runs the application being observed.
That separation is important because it mirrors how a real BYOC deployment feels in practice. You are not just testing whether a Helm chart can install. You are testing whether a customer-controlled cloud environment can support the platform, connect to a workload environment, and produce meaningful telemetry from real application behavior.
The mental model became:
Cloud foundation
→ platform deployment
→ runtime health
→ workload deployment
→ telemetry integration
→ product validation
That made it easier to reason about where failures could happen. For example:
- If the platform cluster is unhealthy, that is a platform infrastructure problem.
- If the workload app is not running, that is a workload deployment problem.
- If the workload is running but no telemetry appears, that is an observability integration problem.
- If telemetry appears but does not answer useful questions, that is a product experience problem.
This separation made the setup easier to troubleshoot and easier to explain.
10. What This Demonstrates
This setup demonstrates several things that are useful from a DevRel or technical advocacy perspective.
1. BYOC is an architecture story
groundcover is not only selling a dashboard. It is selling a deployment model:
Customer cloud
+ customer-controlled infrastructure
+ groundcover-managed observability stack
+ eBPF-based telemetry collection
That is a much richer story than “install an agent and look at charts.”
2. The setup exposes real platform-engineering concerns
The experience touches:
IAM
VPCs
subnets
EKS
RDS
security groups
load balancers
Kubernetes agents
cluster lifecycle
teardown behavior
That means the user journey is closer to a platform engineer’s world than a simple SaaS onboarding flow.
3. Validation matters more than installation
The real milestone is not:
Cluster createdThe real milestone is:
Telemetry from my workload appears in the groundcover UI
and helps me understand the running system.
That is the difference between infrastructure completion and product value.
4. eBPF changes the observability conversation
The interesting part of this setup is that groundcover can derive a lot of visibility from the runtime environment itself.
That matters because modern Kubernetes and AI workloads can be difficult to instrument consistently. Application-level instrumentation is still valuable, but eBPF-based visibility gives the platform a way to observe infrastructure, network behavior, and workload activity without relying entirely on every application being perfectly instrumented first.
5. AI workloads make the validation story more interesting
The demo workload was not only a generic web service. It was an AI travel agent.
That made the validation more useful because the observability question became broader than:
Is the pod running?The more interesting questions were:
Can I see the request?
Can I see the model interaction?
Can I see tool usage?
Can I connect AI behavior back to Kubernetes workload context?
That is where infrastructure observability and AI observability start to come together.
11. Closing Thought
The biggest takeaway from this exercise is that BYOC observability is not only an installation workflow. It is an architecture workflow.
To prove the path, I had to move through cloud infrastructure, Kubernetes runtime health, workload deployment, telemetry integration, and finally product-level validation in the UI.
That is also what makes this kind of setup useful for DevRel work. It creates a concrete story around the product:
Here is the infrastructure.
Here is the workload.
Here is the telemetry path.
Here is the proof that the platform sees what is happening.
For me, the successful endpoint was simple:
I generated activity in my own workload cluster, and I could see that activity represented meaningfully inside groundcover.